Understanding Your Customers Report
In this article
The Customer Report helps you understand who is buying from you. This guide walks you through every section of the report so you know exactly what each number means and how to use it.
Contents
Contents
Where to Find It

On the top navigation bar, click Reports and select Customers.
Filtering and Navigating Your Report

At the top of the report, you will find options to control what data you see:
- Monthly / Yearly — Switch between a monthly view (one month at a time) or a yearly view (the full year at a glance). Use Monthly to check recent activity, and Yearly to see how your customer base has grown over time.
- Month / Year selector — Use the left and right arrows to move between months or years.
- Sales Channels — Filter your report to show customers from a specific sales channel only. Leave it as "All Sales channels" to see everyone combined.
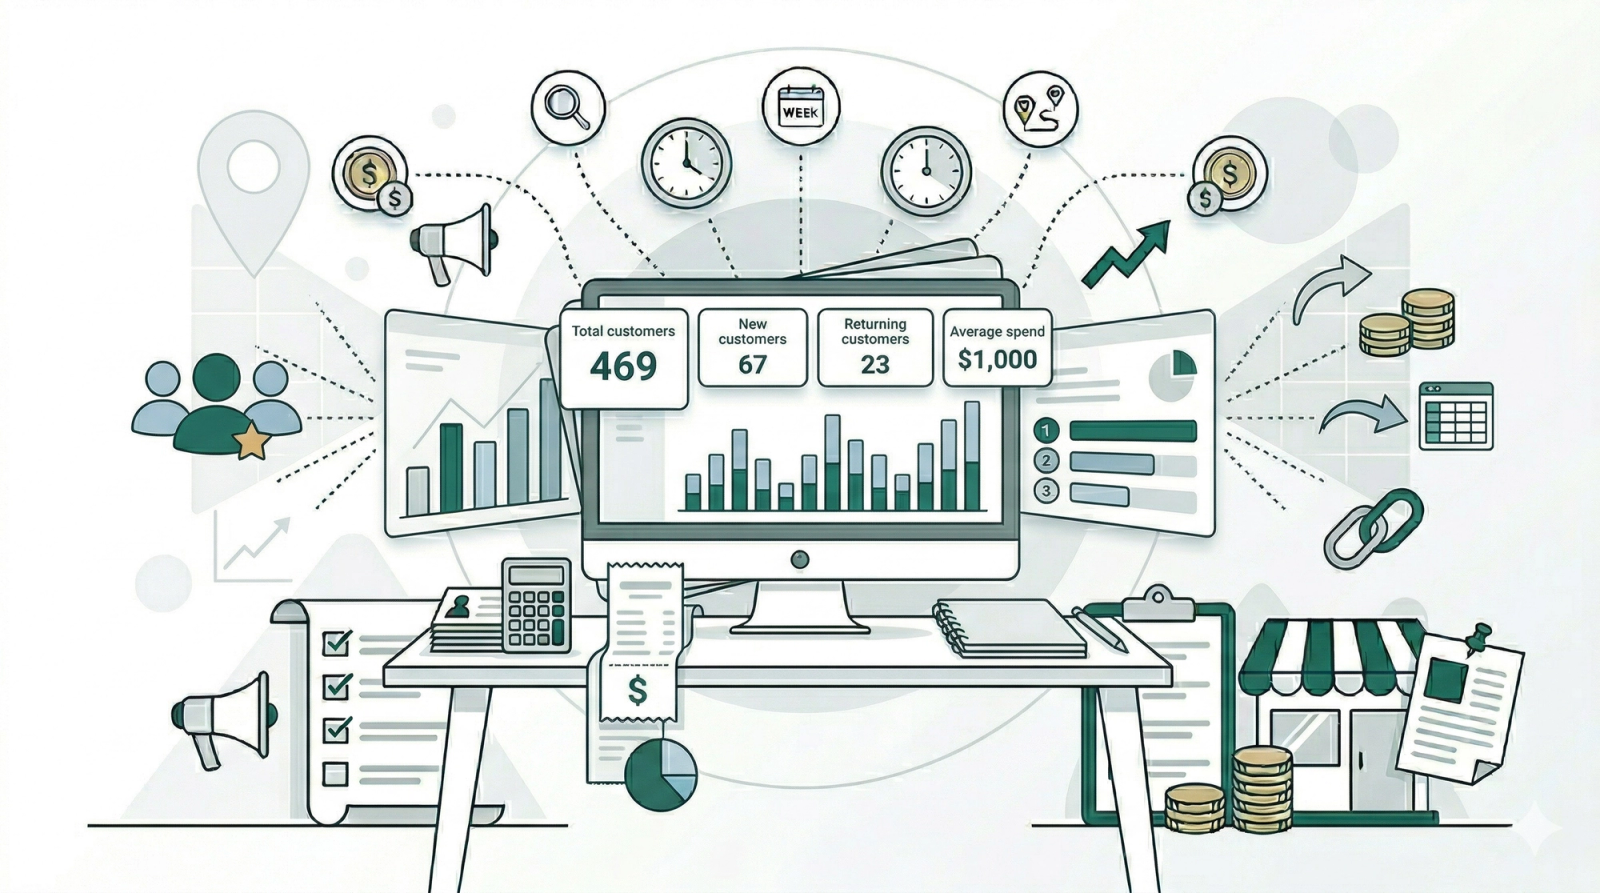
Customer Overview

At the top of the report, you will see four cards that give you a quick snapshot of your customer activity:
- Total Customers — The total number of unique customers who placed an order during the selected period.
- New Customers — Customers who placed their very first order with your business during this period. These are people who have never ordered from you before.
- Returning Customers — Customers who have ordered from you before and came back to place another order during this period.
- Avg Spend/Customer — The average amount each customer spent in total during this period. This is calculated by dividing your total revenue by the number of customers.
On the right side, you will see a more detailed breakdown of your customer numbers:
- One-Time Customers — Customers who only placed one order during this period. This helps you see how many people tried your service but have not come back yet.
- Avg Orders/Customer — The average number of orders each customer placed. A higher number means your customers are coming back more often.
- Avg Spend/Customer — The average total amount each customer spent.
Daily Trend

The bar chart shows your customer activity for each day of the month. Each bar is split into two colors:
- Dark blue — New customers who placed their first order that day.
- Light blue — Returning customers who placed an order that day.
This helps you spot patterns — for example, which days bring in the most new customers, or whether returning customers tend to come back on certain days of the week.
Customers by Business

This table shows how your customers are distributed across your business units or branches. If you operate from multiple locations, this helps you compare which branch is attracting the most customers.
- Business — The name of your business unit or branch.
- Customers — The total number of unique customers at that business.
- New — How many of those customers are first-time buyers.
- Returning — How many are repeat customers.
- Revenue — The total revenue generated by customers at that business.
- Avg Spend — The average amount each customer spent at that business.
- Share % — How much of your total customer base this business makes up.
Top Customers

This table shows your highest-spending customers, ranked from highest to lowest. Use this to identify your most valuable customers and understand their ordering patterns.
- # — The ranking position.
- Name — The customer's name.
- Orders — The total number of orders this customer has placed.
- Total Spent — The total amount this customer has spent with your business.
- Avg Order — The average amount per order for this customer.
- Last Order — The date of their most recent order. This helps you spot if a top customer has not ordered in a while and may need a follow-up.
Exporting Your Customer Report
To save or share your customer data:
- Click the Export button at the top right of the page.
- Choose your Date Range.
- Select a Sales Channel or leave it as "All sales channels."
- Click Export.
The report will be generated as an XLSX file. You can track the progress and download it from the Downloads page.